


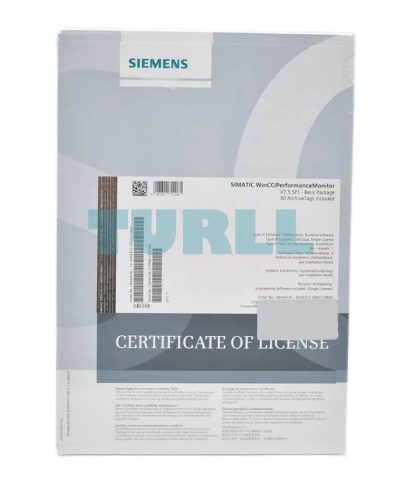
6AV6372-2DG07-5AA0 Siemens WinCC/Performance Monitor Basic P Original Brand New
$2,257.41
6AV6372-2DG07-5AA0
Siemens WinCC/Performance Monitor Basic P, including 30 archive tags, for WinCC V7.5 SP2, runtime software on CD-ROM, single license, license key on USB flash drive – – content: set (1x DVD + 1x USB)

[ez-toc]
Overview
WinCC/PerformanceMonitor –
Analysis and optimization of production on the basis of individual performance indicators
The WinCC/PerformanceMonitor facilitates flexible calculation and powerful analysis of plant-specific key performance indicators (KPIs). The indicators provide the basis for deriving optimization potential, thus enabling productivity enhancement.
They relate to individual machine groups, plant sections or production lines. The elements to be monitored are designated as equipment. Indicators are calculated based on operands which are derived from already configured WinCC tags. By combining them with associated values, more accurate production correlations can be highlighted, such as quality/supplier dependencies.
The calculation formulas used are quick and simple to create in WinCC.
Analysis of the indicators and their operands can be carried out in the WinCC system at any time. Indicators, along with their associated values if required, can be clearly displayed in bar graphs, allowing easy comparison. In addition, the input values of each performance indicator can be shown via an integrated analysis function (drill-down). The Gantt chart illustrates the chronological sequence of the operands. The table display lists the archived values, allowing subsequent correction if required. Performance indicators calculated online, either cyclically or triggered by a tag, can be written to WinCC tags for further processing in WinCC, and display in WinCC images, for example.
The PerformanceMonitor can be combined with the WebNavigator for distribution on the Internet, and with the Information Server for reporting purposes. Integration into WinCC ensures fast configuration and complete transparency across all machine and plant data as a basis for optimizing plant productivity.
- The WinCC/PerformanceMonitor can be installed on a WinCC stand-alone system, WinCC server or WinCC client project (WinCC RT Client license), and consists of an engineering client as well as a runtime user interface.
- The WinCC/PerformanceMonitor provides ActiveX control elements for embedding in WinCC images.
- PerformanceControl: Bar graphs for displaying performance indicators in relation to context values, showing the operands for cause analysis in each case.
- Gantt chart: Chronological sequence of time-based operands
- TableControl: Tabular listing of operands with post correction option.
- With the help of the integrated configuration environment, operands are calculated (based on tags) which can be used to calculate key statistics at the set evaluation time.
- For analysis via intranet or Internet, the controls of the WinCC/PerformanceMonitor are available when using the WinCC/WebNavigator.
- The SIMATIC Information Server can be used for generating plant-specific, web-based reports (predefined and expandable).
Licensing
- The basic package comprises a configuration environment, runtime controls (bars, Gantt, tables) and a license for archiving 30 values.
- The logged values (operands, context) form the basis of the analysis. If more values are to be archived, the number of (additive) archive values can be increased in steps of 30, 100, 300 or 1 000 (countable tags).
You can find more information on the Software Update Service, license types, Online Software Delivery and handling your SW licenses with the Automation License Manager at this link
Benefits
Management and quality assurance
Complete transparency throughout the machine park as the basis for optimizing plant productivity.
- Recording of downtimes, localizing causes and reasons for failure times, and monitoring of equipment efficiency.
- Decision making based on performance indicators.
- Global availability of information server reports means they can be used by different user groups.
- Recognition of production correlations by combining associated values with indicators such as material used.
Servicing and maintenance
Support through cyclic and process-event triggered calculation of characteristics:
- Standardization of new plants by defining controller-based status information for key figure calculation
- Individual, targeted analysis using plant-specific performance indicators.
- Weak-point analysis in production processes and recording of undesirable process activities.
- Cause analysis by examining “drill down to operands” calculation basis.
- Identification of the events that lead to cost-intensive failures.
Line management and plant operator
The operator is always kept up-to-date by graphical display of the characteristics.
- Later modification of archived input values.
- Continuous information at the operator interface thanks to integration in the WinCC user interface.
- Alarm messaging of limit violations and trend recording through cyclic calculation of characteristics.
- Integration into the WinCC system means it is not necessary to train operating personnel
- Quick detection of weaknesses in the process using cyclic calculation of characteristics.
WinCC Engineering
- Quick configuration of WinCC operator displays with WinCC and web-based reports from the Information Server.
- Minimal networking overhead by using the WinCC infrastructure in the local network as well as for the Internet.
- Short familiarization times and simple configuration using familiar tools for user interfaces and reports (WinCC, SIMATIC Information Server)
- Minimal configuration overhead due to the type-instance concept
- Minimal administrative overhead by using the WinCC infrastructure in the local network as well as for the Internet.
Highlights
Creation of performance indicators by the WinCC engineer with subsequent utilization by all user groups in the manufacturing company on WinCC stations or Internet clients.
Application
All user groups benefit from the PerformanceMonitor, from the application engineer to management-level evaluators. The engineer can use the application environment integrated in WinCC to derive individual formulas for calculating performance indicators.
Management uses Web-based reporting without the need for installation on standard computers. For maintenance, the web client of the WebNavigator can be used for analysis with the bar (for performance), progression (Gantt) and table controls. Performance indicators can be displayed on local user interfaces using standard WinCC resources to keep machine operators up to date. The service engineer can analyze the plant from his/her workstation using the WinCC Client, the Webclient of the WinCC/WebNavigator, for example. At the management level, it is possible to access Web-based reports without the need for installation on standard computers.
Function
- Structuring of the production plant in equipment units constituting central elements for evaluation
- Use of structured tags in order to facilitate implementation of machine status models
- WinCC tags are compressed to an operand using formulas
- Calculated operands are stored in the archive
- Archived operands are used as input values for calculating performance indicators
- Bar graphs for analyzing performance indicators and root cause determination (drill down)
Indicator input values (operands) can be displayed if required. - Tabular presentation of all operands (input values)
- Progression diagrams (Gantt charts) of time-based operands
- Cyclic or event-triggered calculation results are written to WinCC tags
- WinCC Runtime, alarm logging and trend logging can utilize cyclically-calculated values
- Database information and evaluations can be displayed at every WinCC station
- Information server reports can be displayed on independent PC workstations
6AV6372-2DG07-5AA0
Siemens WinCC/Performance Monitor Basic P, including 30 archive tags, for WinCC V7.5 SP2, runtime software on CD-ROM, single license, license key on USB flash drive – – content: set (1x DVD + 1x USB)
Visit 6AV6372-2DG07-5AA0
For more our products visit turll.com
| Weight | 0.220 kg |
|---|---|
| Dimensions | 187.00 × 270.00 × 34.00 mm |
You must be logged in to post a review.

Reviews
There are no reviews yet.